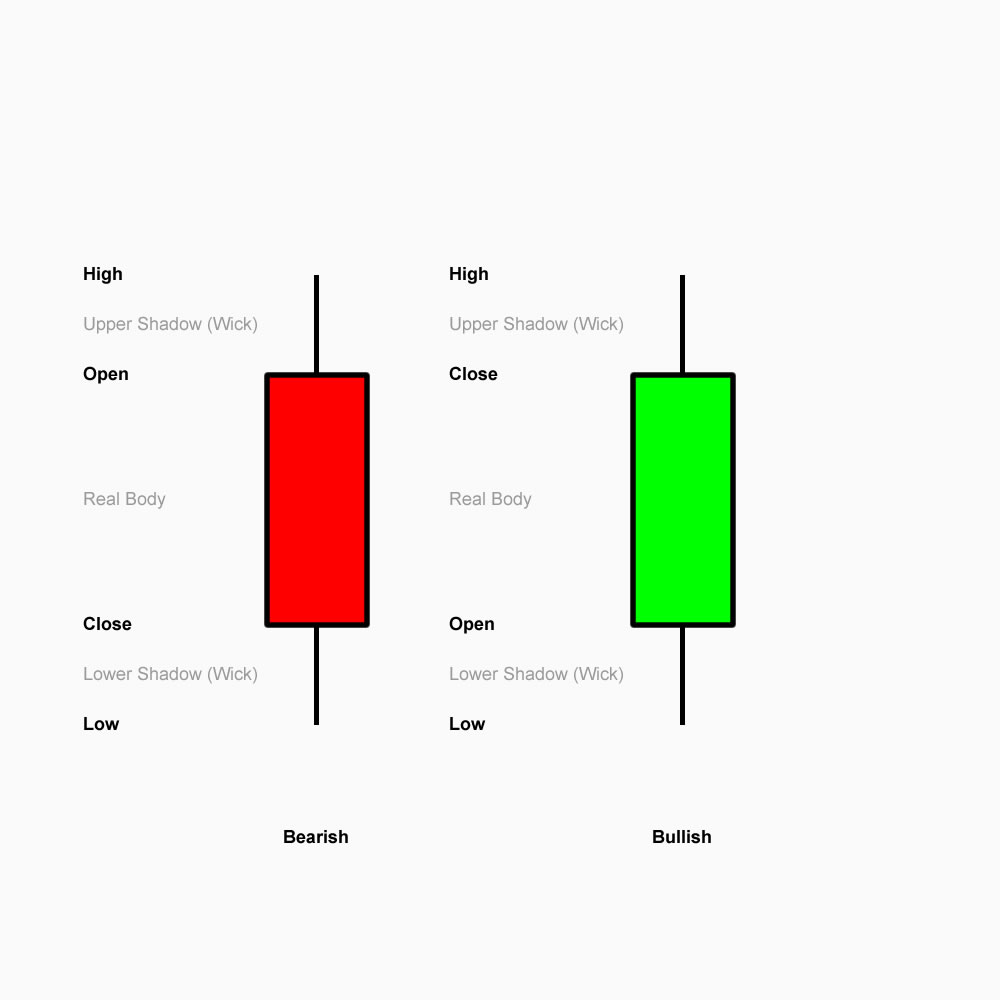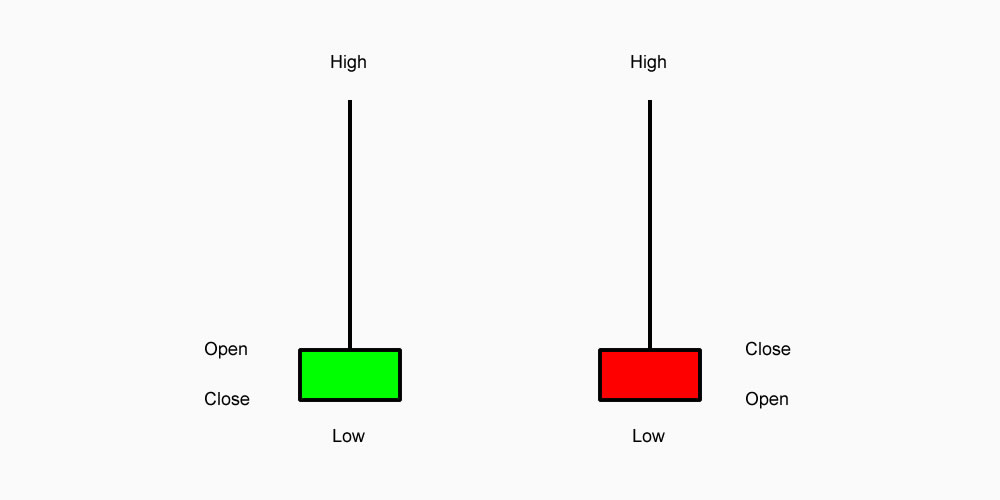
The Inverted Hammer is a candlestick pattern commonly seen in technical analysis, typically at the bottom of a downtrend, indicating potential reversal or a shift in market sentiment. It is a single candlestick pattern with a specific shape and structure, often used by traders to anticipate possible bullish movements. Here’s a detailed breakdown of the Inverted Hammer:
The Inverted Hammer has the following characteristics:
The Inverted Hammer looks similar to the Shooting Star candlestick, but the key difference is their location:
While they share a similar structure, their implications differ based on the prevailing market trend.
Example
Imagine a stock that has been in a downtrend for several weeks. On one particular day, the price opens at $50, moves up to $55, and then closes back at $50. The candle formed would have a small body near the bottom of the candle and a long upper shadow, creating an Inverted Hammer. This suggests that buyers tried to push the price higher, but sellers regained control. If the next day shows a strong bullish candlestick, traders may interpret this as a signal to go long, anticipating the start of an upward trend.
The Inverted Hammer is a useful candlestick pattern that signals potential bullish reversal when it appears at the bottom of a downtrend. It highlights a shift in market sentiment, where buyers begin to show strength despite the prevailing bearish trend. However, for increased reliability, the pattern should be followed by a confirmation of upward movement, and traders should always consider the broader context and other indicators.
Bearish reversal
Medium
Occurring during an uptrend, this pattern characterized by a large black real body, which engulfs a white real body (it doesn’t need to engulf the shadows). This signifies that the uptrend has been hurt and the bears may be gaining strength. The Engulfing indicator is also the first two candles of the Three Outside patterns.
It is a major reversal signal.
Factors that are increasing this signal’s reliability:
| Candlestick | Details |
|---|---|
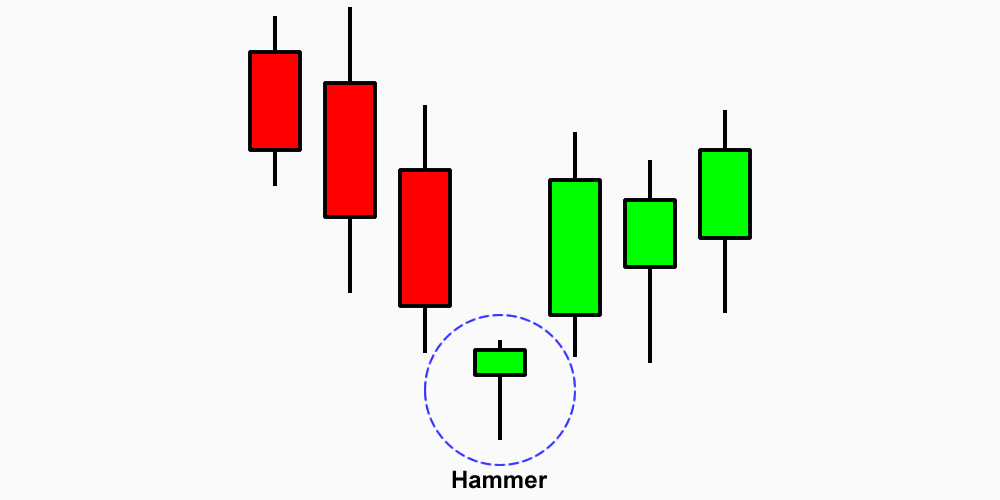
| Pattern: | Hammer |
| Type: | Reversal |
| From: | Downward Trend / Bearish (-) |
| To: | Upward Trend / Bullish (+) |
| Position: | Long (Buy) |
The Hammer candlestick pattern is one of the most well-known reversal patterns in technical analysis. It can signal a potential change in trend direction, particularly when it forms after a downtrend. The Hammer is important because it suggests that the market is attempting to reject lower prices, and it often indicates a shift in market sentiment from bearish to bullish.
The Hammer is a single candlestick pattern that has the following characteristics:
When these conditions are met, it forms the Hammer candlestick. The pattern typically appears at the bottom of a downtrend and can signal a potential reversal or a shift in market sentiment.
Imagine a stock has been in a downtrend, consistently moving lower day by day. On one particular day, the stock opens at $50, falls to $45 during the trading session (forming the long lower shadow), but then rebounds and closes at $49. This forms a Hammer candlestick. The price action shows that, despite initial selling pressure, buyers managed to push the price back up to close nearly where the price opened.
If, the next day, the price opens above $49 and continues to move higher, this would serve as confirmation that the market sentiment may have shifted from bearish to bullish. A trader could then enter a long position, placing a stop loss just below $45 (the low of the Hammer), targeting a return to higher levels.
Understanding the Hammer pattern, along with its nuances, can significantly improve your ability to spot potential reversals and make informed trading decisions.
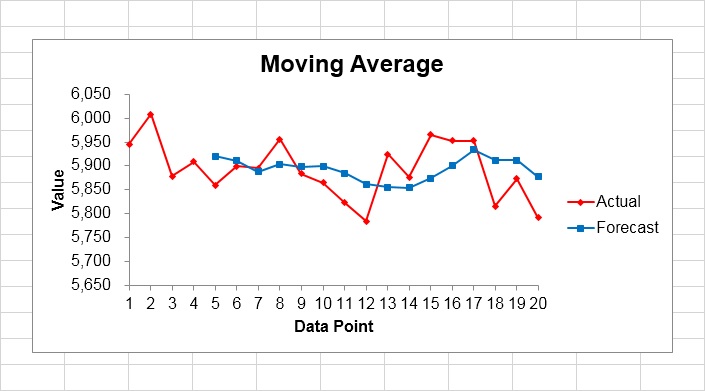
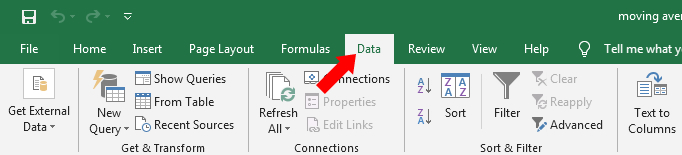
Step 1: Select the ‘Data’ tab.
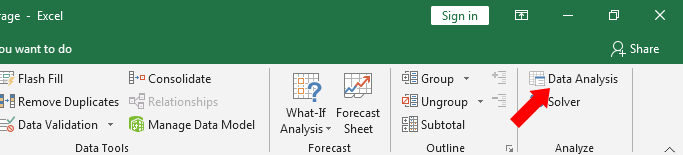
Step 2: Click on ‘Data Analysis’.
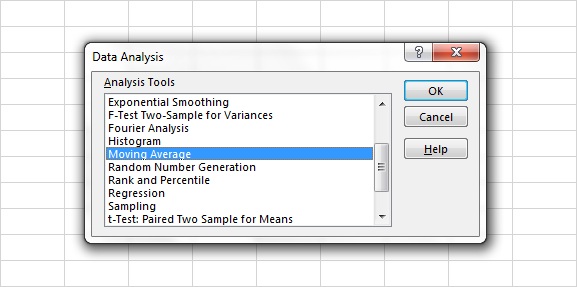
Step 3: Select ‘Moving Average’.
Step 4: Click ‘OK’.
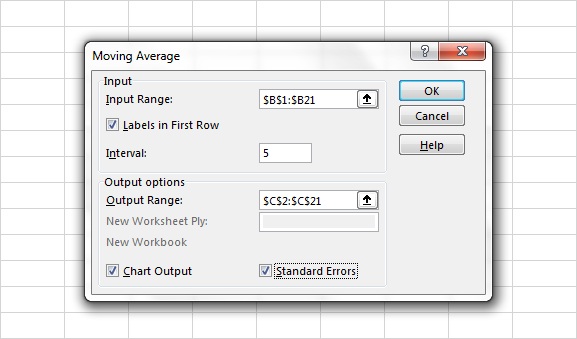
Step 5: Enter the ‘Input Range’.
Step 6: Check ‘Labels in First Row’ (if applicable).
Step 7: Enter the ‘Interval.’
Step 8: Enter the ‘Output Range’.
Step 9: Check the ‘Chart Output’ box (optional).
Step 10: Check the ‘Standard Errors’ box (optional).
Step 11: Click ‘OK’.
| Date | S&P/ASX 200 | MA5 | |||||
|---|---|---|---|---|---|---|---|
| 2020-09-07 | 5944.80 | ||||||
| 2020-09-08 | 6007.80 | ||||||
| 2020-09-09 | 5878.60 | ||||||
| 2020-09-10 | 5908.50 | ||||||
| 2020-09-11 | 5859.40 | 5919.82 | |||||
| 2020-09-14 | 5899.50 | 5910.76 | |||||
| 2020-09-15 | 5894.80 | 5888.16 | |||||
| 2020-09-16 | 5956.10 | 5903.66 | |||||
| 2020-09-17 | 5883.20 | 5898.60 | |||||
| 2020-09-18 | 5864.50 | 5899.62 | |||||
| 2020-09-21 | 5822.60 | 5884.24 | |||||
| 2020-09-22 | 5784.10 | 5862.10 | |||||
| 2020-09-23 | 5923.90 | 5855.66 | |||||
| 2020-09-24 | 5875.90 | 5854.20 | |||||
| 2020-09-25 | 5964.90 | 5874.28 | |||||
| 2020-09-28 | 5952.30 | 5900.22 | |||||
| 2020-09-29 | 5952.10 | 5933.82 | |||||
| 2020-09-30 | 5815.90 | 5912.22 | |||||
| 2020-10-01 | 5872.90 | 5911.62 | |||||
| 2020-10-02 | 5791.50 | 5876.94 |