Last Updated on 2021-05-07 by Admin
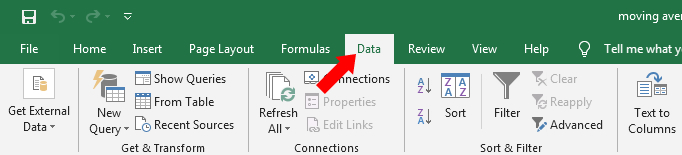
Step 1: Select the ‘Data’ tab.
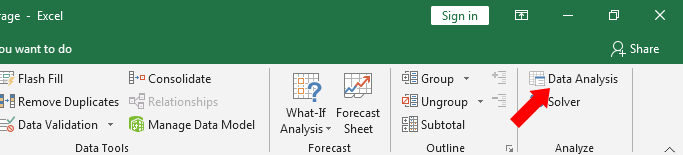
Step 2: Click on ‘Data Analysis’.
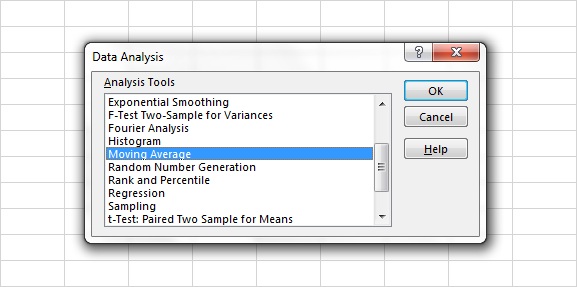
Step 3: Select ‘Moving Average’.
Step 4: Click ‘OK’.
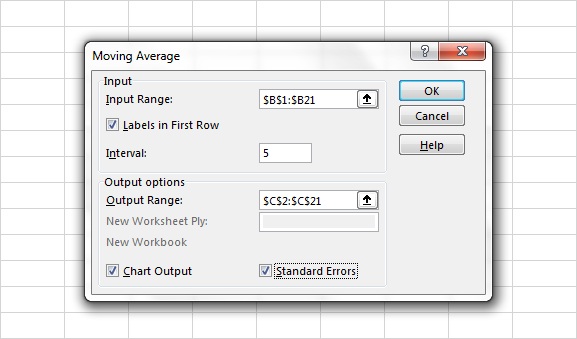
Step 5: Enter the ‘Input Range’.
Step 6: Check ‘Labels in First Row’ (if applicable).
Step 7: Enter the ‘Interval.’
Step 8: Enter the ‘Output Range’.
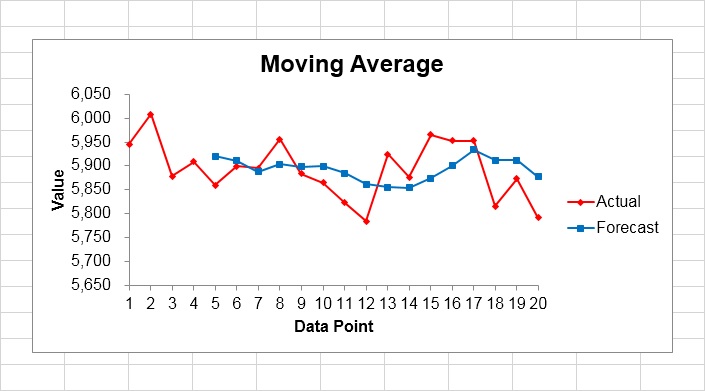
Step 9: Check the ‘Chart Output’ box (optional).
Step 10: Check the ‘Standard Errors’ box (optional).
Step 11: Click ‘OK’.
| Date | S&P/ASX 200 | MA5 | |||||
|---|---|---|---|---|---|---|---|
| 2020-09-07 | 5944.80 | ||||||
| 2020-09-08 | 6007.80 | ||||||
| 2020-09-09 | 5878.60 | ||||||
| 2020-09-10 | 5908.50 | ||||||
| 2020-09-11 | 5859.40 | 5919.82 | |||||
| 2020-09-14 | 5899.50 | 5910.76 | |||||
| 2020-09-15 | 5894.80 | 5888.16 | |||||
| 2020-09-16 | 5956.10 | 5903.66 | |||||
| 2020-09-17 | 5883.20 | 5898.60 | |||||
| 2020-09-18 | 5864.50 | 5899.62 | |||||
| 2020-09-21 | 5822.60 | 5884.24 | |||||
| 2020-09-22 | 5784.10 | 5862.10 | |||||
| 2020-09-23 | 5923.90 | 5855.66 | |||||
| 2020-09-24 | 5875.90 | 5854.20 | |||||
| 2020-09-25 | 5964.90 | 5874.28 | |||||
| 2020-09-28 | 5952.30 | 5900.22 | |||||
| 2020-09-29 | 5952.10 | 5933.82 | |||||
| 2020-09-30 | 5815.90 | 5912.22 | |||||
| 2020-10-01 | 5872.90 | 5911.62 | |||||
| 2020-10-02 | 5791.50 | 5876.94 |