Financial Instruments

Buying Index Puts


Buying Index Puts is a straightforward and popular options trading strategy used by investors who have a bearish outlook on an underlying stock index. In this strategy, the investor buys a put option on an index (such as the S&P 500, Nasdaq-100, or other indices), which gives the buyer the right, but not the obligation, to sell the underlying index at a specific strike price before or on the expiration date of the option.

The primary goal of buying index puts is to profit from a decline in the value of the underlying index, with the benefit of limited risk. If the index falls significantly below the strike price, the investor can either exercise the put (if the option is in the money) or sell the option to lock in profits.


Key Elements
  1. Put Option: A put option gives the buyer the right to sell the underlying asset (in this case, the index) at a specific strike price within a certain period. It is used when the investor expects the price of the asset to decline.
  2. Index: Instead of buying individual stock options, an index put involves purchasing a put on a stock index, such as:
    • S&P 500 (SPX)
    • Nasdaq-100 (NDX)
    • Dow Jones Industrial Average (DJX)
    • Russell 2000 (RUT)
  3. Strike Price: The strike price is the price at which the buyer of the put can sell the underlying index. The strike price is a critical factor in determining how profitable the option will be.
  4. Expiration Date: The expiration date is the last day the option can be exercised or traded before it expires. If the option is not exercised by this date, it becomes worthless.
  5. Premium: The premium is the amount of money the buyer pays to purchase the put option. This is the upfront cost of the option and represents the maximum loss the buyer can incur.


Objective

The objective of buying an index put is to profit from a decline in the value of the underlying index. If the index falls below the strike price of the put option, the option becomes in the money, and the investor can sell the option at a profit or exercise the option to sell the index at a higher price than its current market value.

In simpler terms, buying an index put allows an investor to bet on a decrease in the market or a specific sector represented by the index. If the market falls, the value of the put option increases, potentially resulting in profits.


Mechanics
  1. Buy a Put Option: The investor purchases a put option on the index with a specific strike price and expiration date. The cost of this option is the premium.
  2. Market Movement: If the index falls below the strike price, the put option becomes in the money and increases in value. If the index remains above the strike price or increases in value, the put option expires worthless.
  3. Expiration: The option expires on the expiration date. If the index is below the strike price at expiration, the buyer can either exercise the option (selling the index at the strike price) or sell the option in the market for a profit.


Maximum Profit

  • The maximum profit in buying an index put is theoretically limited only by how low the index can fall. The lower the index falls, the more valuable the put option becomes.
  • The maximum profit occurs when the index falls to zero (although this is unlikely), as the option would be worth its strike price minus the premium paid.

Mathematically:

  • Maximum Profit = Strike Price of the Put – Premium Paid.


Maximum Loss

  • The maximum loss is limited to the premium paid for the put option. If the index remains above the strike price (or rises) and the option expires worthless, the investor loses the entire premium paid for the option.

Mathematically:

  • Maximum Loss = Premium Paid for the Put Option.


Breakeven Point

The breakeven point is the index level at which the gains from the put option exactly offset the premium paid. It occurs when the value of the index is equal to the strike price minus the premium paid.

Mathematically:

  • Breakeven = Strike Price of the Put – Premium Paid.


Example

Let’s say the S&P 500 is currently trading at 4,000, and you expect the index to decline in the next month. Here’s how you might execute a buying index put strategy:

  1. Buy a Put Option: You buy a put option on the S&P 500 (SPX) with a strike price of 3,900, expiring in one month, for a premium of $50 per index point.
  2. Cost of the Option: The total cost of the option is calculated as the premium times the contract multiplier. For S&P 500 options, each contract represents 100 times the index value.
    • Total cost = $50 premium x 100 (contract size) = $5,000.


Outcomes

  • If the S&P 500 falls to 3,800 by expiration:
    • The option is in the money by 100 points (3,900 – 3,800).
    • The value of the option increases by 100 points, so your profit is 100 x $50 = $5,000.
  • If the S&P 500 falls to 3,850 by expiration:
    • The option is in the money by 50 points (3,900 – 3,850).
    • The value of the option increases by 50 points, so your profit is 50 x $50 = $2,500.
  • If the S&P 500 remains above 3,900 by expiration:
    • The option expires worthless.
    • Your loss is limited to the premium paid for the option, which is $5,000.


Risk/Reward Profile

  • Maximum Loss: The maximum loss is limited to the premium paid for the put option, which is known in advance and is the maximum amount at risk.
  • Maximum Profit: The maximum profit is theoretically unlimited to the downside (if the index falls to zero).
  • Breakeven Point: The breakeven point is the strike price of the put minus the premium paid for the option.


When to Buy

  • Bearish Outlook: You expect the overall market or a specific index to decline over a certain period of time.
  • Market Decline Hedging: Buying index puts is an effective way to hedge against market downturns or protect existing portfolio positions from a potential market crash.
  • Volatility: Index puts can be a good strategy if you expect increased market volatility and anticipate a significant drop in the value of the index.
  • Leverage: Buying puts allows you to gain exposure to a broad market decline with less capital than shorting the index or buying inverse ETFs.


Pros

  1. Limited Risk: The maximum risk is limited to the premium paid for the put option, making it a defined-risk strategy.
  2. Profit from a Market Decline: The strategy allows you to profit from a decline in the market or specific index, providing a way to capitalize on bear markets or corrections.
  3. Hedge Against Losses: Buying index puts can serve as an effective hedge for other investments, particularly long equity positions, during periods of high market risk.
  4. Leverage: Puts provide leverage, as you can control a large amount of index exposure for a relatively small investment (the premium).


Cons

  1. Premium Cost: The cost of buying index puts can be high, particularly if volatility is elevated. If the market doesn’t move as expected, the premium paid can result in a significant loss.
  2. Time Decay: The value of the put option decreases as time passes, due to theta (time decay). If the market doesn’t fall quickly enough, the option may lose value even if the index eventually declines.
  3. Expiration Risk: The option has an expiration date, and if the market doesn’t decline before the expiration, the put option can expire worthless, resulting in a loss of the premium paid.
  4. Requires Correct Timing: To be profitable, the index must fall below the strike price before the option expires. If the market stays flat or rises, the investor will lose the premium paid.


Example Summary

  • Index: S&P 500 (SPX)
  • Current Price: 4,000
  • Buy 3,900 Put for a premium of $50
  • Cost of Option = $50 x 100 = $5,000
  • Maximum Loss = $5,000 (if SPX remains above 3,900)
  • Maximum Profit = Unlimited (if SPX falls dramatically)
  • Breakeven = $3,900 – $50 = $3,850


Conclusion

Buying index puts is a bearish options strategy used to profit from a decline in the value of an underlying index. It offers limited risk (the premium paid) and the potential for unlimited profit if the index falls significantly. This strategy is useful for speculating on market declines, hedging existing positions, or capitalizing on market volatility. However, the strategy requires careful timing, as the option’s value erodes over time, and the investor must anticipate a significant move before expiration to realize a profit.


Buying Index Calls


Buying Index Calls is a straightforward and popular options trading strategy where an investor purchases a call option on an index (such as the S&P 500, Nasdaq-100, or any other financial index). A call option gives the buyer the right, but not the obligation, to buy the underlying asset (in this case, the index) at a specific strike price before or on the expiration date.

When buying an index call, the investor expects that the value of the underlying index will increase (rise) during the life of the option. The primary goal is to profit from price appreciation of the index while limiting the amount of capital at risk (since the risk is limited to the premium paid for the call option).


Key Elements
  1. Call Option: A call option is a financial contract that gives the buyer the right (but not the obligation) to buy the underlying index at a specific strike price by a specific expiration date.
  2. Index: Instead of buying options on individual stocks, buying index calls involves purchasing calls on a stock index, such as:
    • S&P 500 (SPX)
    • Nasdaq-100 (NDX)
    • Dow Jones Industrial Average (DJX)
    • Russell 2000 (RUT)
  3. Strike Price: The strike price is the price at which the buyer can exercise the option. It’s typically chosen to reflect the investor’s outlook on where the index will move.
  4. Expiration Date: The date by which the option must be exercised. This is the last day the option can be traded or exercised before it expires.
  5. Premium: The cost of the option, paid upfront. The premium is the price the investor pays to buy the option.


Objective

The main goal of buying index calls is to profit from a rise in the value of the index. If the value of the index increases significantly above the strike price, the investor can exercise the option (if the call option is in the money), or they can sell the option for a profit.

Unlike buying individual stocks, buying options on an index allows the investor to speculate on the overall direction of the market or a broad sector rather than a specific stock.


Mechanics
  1. Buy a Call Option: The investor purchases a call option on an index with a specific strike price and expiration date. The cost of this option is the premium.
  2. Market Movement: If the index rises above the strike price, the call option becomes in the money, and the investor can profit by exercising the option or selling it for a gain.
  3. Expiration: If the index does not rise above the strike price (or stays flat), the option expires worthless, and the investor loses the premium paid.


Maximum Profit

  • Maximum Profit is theoretically unlimited because there is no cap on how high the index can rise. As the index increases, the value of the call option rises correspondingly.
  • In practice, the profit is capped only by the price appreciation of the index.

Mathematically:

  • Maximum Profit = Unlimited (as long as the index keeps rising).


Maximum Loss

  • Maximum Loss is limited to the premium paid for the call option. If the index does not rise above the strike price (or stays flat), the option expires worthless, and the investor loses the entire premium.

Mathematically:

  • Maximum Loss = Premium Paid for the Call Option.

Breakeven Point

The breakeven point is the price level that the index needs to reach for the buyer to recoup the cost of the premium paid for the option. It is calculated by adding the premium paid for the call to the strike price of the option.

Mathematically:

  • Breakeven = Strike Price of the Call + Premium Paid.


Example

Let’s say you are interested in the S&P 500 Index (SPX), which is currently trading at 4,000. You believe that the S&P 500 will rise in the coming months. Here’s how you would buy an index call:

  1. Buy a Call Option: You purchase a call option on the S&P 500 with a strike price of 4,100, expiring in one month, for a premium of $50.
  2. Cost of the Option: The cost of the option is the premium paid. In this case, you pay $50 per contract. Since one SPX contract represents $100 times the index, the total cost of the option would be $50 x 100 = $5,000.


Outcomes

  • If the S&P 500 rises to 4,200 by expiration:
    • The option is in the money by 100 points (4,200 – 4,100).
    • The value of the option increases by 100 points, so your profit would be 100 x $50 = $5,000.
  • If the S&P 500 rises to 4,150 by expiration:
    • The option is in the money by 50 points (4,150 – 4,100).
    • The value of the option increases by 50 points, so your profit would be 50 x $50 = $2,500.
  • If the S&P 500 remains below 4,100 by expiration:
    • The option expires worthless.
    • Your loss is limited to the premium paid, which is $5,000.


Risk/Reward Profile

  • Maximum Loss: The maximum loss is the premium paid for the option. This occurs if the index remains below the strike price of the call option at expiration, causing the option to expire worthless.
  • Maximum Profit: The maximum profit is theoretically unlimited, as the index could keep rising, and the value of the call option increases with it.
  • Breakeven Point: The breakeven point is the strike price of the call option plus the premium paid. If the index reaches or exceeds this level, the investor begins to make a profit.


When to Buy
  • Bullish Outlook: You believe the overall market or a specific index (e.g., S&P 500) will rise over a certain time frame. Buying index calls is a good strategy if you expect the index to increase significantly.
  • Leverage: Index calls allow you to control a large amount of exposure to the market with relatively little capital (compared to buying the underlying index itself). This makes index calls an attractive choice for investors seeking leverage.
  • Low-Risk Strategy: Buying calls provides limited risk, as the most you can lose is the premium you paid for the call. This can be appealing compared to outright purchases of stocks or ETFs, where losses can be much larger.


Pros

  1. Limited Risk: The risk is limited to the premium paid for the call, so it is easier to manage and define the potential loss.
  2. Unlimited Profit Potential: Since there’s no cap on how high an index can rise, the profit potential is theoretically unlimited.
  3. Leverage: Options allow you to control a large amount of the underlying asset for a fraction of the price of actually buying the index.
  4. Hedging: Index calls can be used as a way to hedge long positions in a portfolio if you expect the index to rise or if you want to protect against potential market corrections.


Cons

  1. Premium Paid: The cost of the option (the premium) can be expensive, especially in volatile markets. If the index doesn’t move above the strike price, the option will expire worthless, and the premium is lost.
  2. Time Decay: Call options lose value over time due to theta (time decay). If the index doesn’t move quickly enough, the value of the option might erode before it reaches profitability.
  3. Market Timing: For the trade to be profitable, the index must rise above the strike price before the option expires. If the index doesn’t move as expected, you could lose your entire premium.
  4. Volatility: Option prices are affected by implied volatility. If volatility decreases after you purchase the option, it can reduce the option’s value even if the index moves in the direction you expect.


Example Summary

  • Index: S&P 500 (SPX)
  • Current Price: 4,000
  • Buy 4,100 Call for a premium of $50
  • Cost of Option = $50 x 100 = $5,000
  • Maximum Loss = $5,000 (if SPX remains below 4,100)
  • Maximum Profit = Unlimited (if SPX rises significantly above 4,100)


Conclusion

Buying index calls is a bullish strategy that allows investors to profit from an expected rise in the value of an index. The strategy provides limited risk (the premium paid) and unlimited profit potential if the index rises above the strike price. It’s an effective tool for leveraging bullish market views, but the trade must be executed with careful attention to timing, volatility, and the overall market outlook to be successful.


Bull Put Spread (Credit Put Spread)


The Bull Put Spread (also known as a Credit Put Spread) is an options trading strategy that is typically used when an investor has a moderately bullish outlook on an underlying asset. The strategy involves selling a put option at a higher strike price and buying a put option at a lower strike price, both with the same expiration date. This setup results in a net credit to the trader’s account, as the premium received from selling the higher strike put is greater than the premium paid for buying the lower strike put.

The Bull Put Spread is a limited-risk, limited-reward strategy that benefits when the price of the underlying asset stays above the strike price of the put option sold (the higher strike) and the options expire worthless.


Key Elements
  1. Sell a Put Option (Short Put): The trader sells a put option with a higher strike price. This obligates the trader to buy the underlying asset at the strike price if the option is exercised.
  2. Buy a Put Option (Long Put): The trader buys a put option with a lower strike price. This limits the risk on the position if the price of the underlying asset falls below the lower strike price.
  3. Same Expiration Date: Both the put options have the same expiration date.


Objective

The goal of a Bull Put Spread is to profit from a stable or moderately bullish move in the underlying asset’s price. The strategy profits when the price of the asset remains above the higher strike price of the sold put option, allowing both puts to expire worthless and the trader to keep the net premium received as profit.

This strategy is designed to limit risk (because the purchased put provides protection) while providing a defined, capped profit potential.


Mechanics of the Trade
  1. Sell a Put (Short Put): By selling the higher strike put, the trader collects a premium upfront.
  2. Buy a Put (Long Put): By buying the lower strike put, the trader pays a premium for the right to sell the underlying asset at a lower price. This option limits the potential loss on the trade.

The combination of these two options results in a net credit, meaning the trader receives more money from selling the higher strike put than they pay for buying the lower strike put.


Maximum Profit

  • The maximum profit occurs if the price of the underlying asset stays above the strike price of the sold put at expiration. In this case, both put options expire worthless, and the trader keeps the full premium received for the spread.


Mathematically

  • Maximum Profit = Net Premium Received (the difference between the premium received from the short put and the premium paid for the long put).


Maximum Loss

  • The maximum loss occurs if the price of the underlying asset falls below the strike price of the bought put. In this case, the trader will have to purchase the underlying asset at the higher strike price (from the short put) but can sell it at the lower strike price (from the long put).
  • The maximum loss is the difference between the strike prices of the two puts, minus the net premium received.


Mathematically

  • Maximum Loss = (Strike Price of the Sold Put – Strike Price of the Bought Put) – Net Premium Received


Breakeven Point

The breakeven point occurs when the price of the underlying asset is such that the profit from the premium received from the short put is exactly offset by the loss on the long put. It is calculated as the strike price of the sold put minus the net premium received.


Mathematically

  • Breakeven = Strike Price of the Sold Put – Net Premium Received


Example

Let’s say a stock is currently trading at $100. The trader is moderately bullish and wants to create a Bull Put Spread:

  1. Sell a Put Option with a strike price of $95 for a premium of $4.
  2. Buy a Put Option with a strike price of $90 for a premium of $2.


Net Premium Received

  • Premium from selling the $95 put = $4.
  • Premium for buying the $90 put = $2.
  • Net premium received = $4 – $2 = $2 per share.


Maximum Profit

The maximum profit occurs if the stock price remains above $95 at expiration (both options expire worthless).

  • Maximum Profit = Net Premium Received = $2 per share.


Maximum Loss

The maximum loss occurs if the stock price falls below $90 at expiration.

  • Maximum Loss = (Strike Price of Sold Put – Strike Price of Bought Put) – Net Premium Received = ($95 – $90) – $2 = $5 – $2 = $3 per share.


Breakeven Point

The breakeven point occurs when the stock price is equal to the strike price of the sold put minus the net premium received.

  • Breakeven = $95 – $2 = $93 per share.


Risk/Reward Profile

  • Risk: The maximum risk is the difference between the two strike prices, minus the premium received. It is a limited loss, which is one of the key benefits of this strategy.
  • Reward: The maximum reward is limited to the net premium received when entering the position, which is the most the trader can earn.

The reward-to-risk ratio can vary depending on the size of the premium received relative to the distance between the two strike prices.


When to Use
  • The strategy is best suited when the trader has a moderately bullish outlook on the underlying asset and believes that the price will stay above the strike price of the sold put option.
  • The trader expects the asset’s price to either stay stable or rise moderately, but they want to limit the risk and cost of entering a position.
  • The strategy works well when implied volatility is high, as the higher premiums can increase the net credit received for the spread.


Pros

  1. Limited Risk: The maximum loss is capped and known at the time of entering the trade, making it easier to manage.
  2. Income Generation: The strategy allows you to collect a premium upfront, generating income if the market moves as expected.
  3. Ideal for a Neutral to Bullish Market: The strategy profits from moderate price increases or stability, making it well-suited for sideways or bullish markets.
  4. Lower Cost Than Buying a Put Option: Since the sold put offsets the cost of the bought put, the net premium received helps reduce the cost of the trade.


Cons

  1. Limited Profit Potential: The profit is capped at the premium received, so if the price of the underlying asset rises significantly, the trader will not benefit beyond that point.
  2. Requires Correct Timing: For the trade to be profitable, the price of the underlying asset must stay above the strike price of the sold put. If the price drops significantly, the strategy will result in losses.
  3. Obligation to Buy: If the price of the asset falls below the strike price of the sold put, the trader may be obligated to buy the asset at a price higher than its current market value, resulting in a potential loss.


Example Summary

  • Stock price = $100
  • Sell $95 Put for $4
  • Buy $90 Put for $2
  • Net Premium Received = $2 per share
  • Maximum Profit = $2 (if stock price stays above $95)
  • Maximum Loss = $3 (if stock price falls below $90)
  • Breakeven = $93 (if stock price is at $93)


Conclusion

The Bull Put Spread (or Credit Put Spread) is a limited-risk, limited-reward strategy used when a trader has a moderately bullish outlook on an underlying asset. It involves selling a higher strike put option and buying a lower strike put option, both with the same expiration date. The strategy benefits from a stable or rising market, with the potential to earn a net premium if the stock price stays above the strike price of the sold put. While the profit is capped, the strategy provides a defined risk and is an efficient way to generate income in moderately bullish market conditions.


Bull Call Spread (Debit Call Spread)


The Bull Call Spread (also known as a Debit Call Spread) is a popular options trading strategy used when an investor has a bullish outlook on an underlying asset but wants to limit both the cost and the risk of the trade. The strategy involves buying a call option at a lower strike price and selling a call option at a higher strike price, both with the same expiration date.


Key Elements
  1. Buy a Call Option (Long Call): The trader buys a call option with a lower strike price, which gives the right to buy the underlying asset at that strike price.
  2. Sell a Call Option (Short Call): The trader sells a call option with a higher strike price, which obligates them to sell the underlying asset at that strike price if the option is exercised.
  3. Same Expiration Date: Both call options have the same expiration date.

This strategy is called a “debit spread” because the trader pays a net debit to enter the position, meaning the cost of buying the call option is higher than the premium received from selling the other call.


Objective

The main goal of a Bull Call Spread is to profit from a moderate increase in the price of the underlying asset while limiting both the cost of the trade and the risk. This is done by combining the purchase of a call (which gives unlimited upside potential) with the sale of a call (which offsets part of the cost of the trade, limiting risk).


Mechanics of the Trade

  1. Buy a Call (Long Call): The long call option gives you the right to buy the underlying asset at the lower strike price. You pay a premium for this option.
  2. Sell a Call (Short Call): The short call option obligates you to sell the underlying asset at the higher strike price. You receive a premium for selling this option.

The key feature of the Bull Call Spread is that it allows you to capitalize on a moderate upward movement in the underlying asset’s price, but with limited risk.


Maximum Profit

  • The maximum profit occurs when the price of the underlying asset rises above the higher strike price at expiration.
  • The maximum profit is the difference between the two strike prices, minus the net premium paid to enter the position.


Mathematically

  • Maximum Profit = (Strike Price of the Sold Call – Strike Price of the Bought Call) – Net Premium Paid


Maximum Loss

  • The maximum loss occurs if the price of the underlying asset stays below the lower strike price at expiration. In this case, both calls expire worthless, and the trader loses the premium paid.
  • The maximum loss is limited to the net premium paid for the spread.


Mathematically

  • Maximum Loss = Net Premium Paid


Breakeven Point

The breakeven point occurs when the price of the underlying asset is such that the gains from the long call (the bought call) offset the cost of the trade (the net premium paid). This is calculated as the strike price of the long call plus the net premium paid.


Mathematically

  • Breakeven = Strike Price of the Long Call + Net Premium Paid


Example

Let’s assume a stock is currently trading at $100. The trader expects the stock to rise moderately but wants to limit their risk.

  1. Buy a Call with a strike price of $100 for a premium of $5.
  2. Sell a Call with a strike price of $110 for a premium of $2.


Net Premium Paid

  • The trader pays $5 for the long call and receives $2 for the short call.
  • Net Premium Paid = $5 – $2 = $3 per share.


Maximum Profit

The maximum profit occurs if the stock price is at or above $110 at expiration.

  • Maximum Profit = $110 (strike of short call) – $100 (strike of long call) – $3 (net premium paid) = $7 per share.


Maximum Loss

The maximum loss occurs if the stock price is below $100 at expiration, as both options would expire worthless.

  • Maximum Loss = Net Premium Paid = $3 per share.


Breakeven Point

The breakeven point occurs when the stock price is equal to the strike price of the long call plus the net premium paid.

  • Breakeven = $100 + $3 = $103 per share.


Risk/Reward Profile

  • Risk: The risk is limited to the net premium paid for the position, which is the maximum loss.
  • Reward: The reward is limited to the difference between the two strike prices minus the net premium paid.


When to Use

  • The strategy is ideal when you have a bullish outlook on an underlying asset, but you expect the price to rise moderately rather than dramatically.
  • It is used when the investor wants to limit risk and reduce the cost of buying a long call option, making it more affordable.
  • The strategy works best in a market where volatility is moderate and you expect the asset to move upwards but not surge too far beyond the higher strike price.


Pros

  1. Limited Risk: The maximum loss is limited to the net premium paid, making this a safer alternative to buying a call outright, where the potential loss can be substantial.
  2. Cost-Effective: By selling a call to offset the cost of buying a call, you reduce the overall cost of entering a bullish position. This makes it cheaper than just purchasing a single call option.
  3. Defined Profit and Loss: Both the maximum potential profit and the maximum potential loss are known at the time of entering the trade.


Cons

  1. Limited Profit Potential: The profit is capped at the difference between the two strike prices, minus the net premium paid. If the price of the underlying asset rises sharply, the trader will not benefit beyond the higher strike price.
  2. Requires Correct Timing: To be profitable, the underlying asset must rise enough to cover the premium paid (i.e., to reach the breakeven point). If the asset moves too slowly or does not rise at all, the position can result in a loss.
  3. Opportunity Cost: If the underlying asset’s price surges significantly above the higher strike price, the trader misses out on potential profits because of the sold call.


Example Summary

  • Stock price = $100
  • Buy $100 Call for $5
  • Sell $110 Call for $2
  • Net Premium Paid = $3
  • Maximum Profit = $7 (if the stock price is at or above $110)
  • Maximum Loss = $3 (if the stock price is below $100)
  • Breakeven = $103 (if the stock price is $103)


Conclusion

The Bull Call Spread (or Debit Call Spread) is a cost-effective, limited-risk options strategy for traders who are moderately bullish on an asset. It allows the trader to profit from a moderate upward move in the price of the underlying asset while controlling the potential loss. While the profit potential is capped, the strategy provides a balanced risk/reward profile and is well-suited for situations where you expect the underlying asset to rise, but not too dramatically.


Bear Spread Spread (Double Bear Spread, Combination Bear Spread)


The Bear Spread Spread, also known as a Double Bear Spread or Combination Bear Spread, is a sophisticated options strategy that combines elements of two Bear Spread strategies (typically a Bear Put Spread or Bear Call Spread) to create a position with multiple layers of risk and reward. While it’s not as commonly discussed as simpler spreads, it can be an effective tool in specific market conditions.


Key Elements
  1. Two Separate Bear Spreads: The strategy typically involves setting up two Bear Put Spreads or Bear Call Spreads simultaneously, or sometimes a combination of both. The two spreads have different strike prices and expiration dates, allowing for a more nuanced risk-reward profile.
  2. Different Strike Prices: The two spreads will have different strike prices, often targeting different price ranges for the underlying asset. This allows for more specific risk control in a moderately bearish market environment.
  3. Potential Use of Different Expiration Dates: The positions in the Bear Spread Spread may also use options with different expiration dates, adding another layer of flexibility and allowing for the possibility of managing risk over multiple time frames.


Objective

The goal of the Bear Spread Spread is to create a complex bearish position where the trader can take advantage of the moderate bearish movement of the underlying asset, while limiting risk exposure. This strategy is designed to allow the trader to capitalize on multiple levels of price movement, making it more flexible and potentially more profitable in a market with moderate volatility.

The strategy has limited profit potential but offers greater flexibility in structuring risk-reward scenarios, particularly if a trader believes the underlying asset will decline in stages or at varying rates over time.


Key Variations
  • Double Bear Put Spread: Involves using two different Bear Put Spreads with varying strike prices or expiration dates.
  • Double Bear Call Spread: Involves using two different Bear Call Spreads with varying strike prices or expiration dates.
  • Combination Bear Spread: A blend of Bear Call Spreads and Bear Put Spreads, typically combining the best aspects of both strategies.


Construction

Let’s break down a Double Bear Put Spread example:


Example Setup

Imagine you have a stock trading at $100. You are bearish on the stock and want to create a Double Bear Put Spread:

  1. Bear Put Spread 1 (short-term):
    • Buy a Put option at a strike price of $105 for a premium of $7.
    • Sell a Put option at a strike price of $100 for a premium of $3.
    • Net premium paid = $7 – $3 = $4 per share.
  2. Bear Put Spread 2 (long-term):
    • Buy a Put option at a strike price of $110 for a premium of $10.
    • Sell a Put option at a strike price of $105 for a premium of $6.
    • Net premium paid = $10 – $6 = $4 per share.


Net Premium Paid

  • The total premium paid for the entire position is $4 (from the first Bear Put Spread) + $4 (from the second Bear Put Spread) = $8 per share.


Maximum Profit

  • For both Bear Put Spreads, the maximum profit happens if the stock price is below $100 at expiration.
  • Maximum Profit for Bear Put Spread 1: $105 (strike of the long put) – $100 (strike of the short put) – $4 (net premium paid) = $1 per share.
  • Maximum Profit for Bear Put Spread 2: $110 (strike of the long put) – $105 (strike of the short put) – $4 (net premium paid) = $1 per share.
  • Total Maximum Profit = $1 + $1 = $2 per share.


Maximum Loss

  • The maximum loss happens if the stock price is above $105 at expiration, as the long puts will expire worthless, and the short puts will be exercised.
  • Maximum Loss for Bear Put Spread 1: The total premium paid, which is $4 per share.
  • Maximum Loss for Bear Put Spread 2: The total premium paid, which is $4 per share.
  • Total Maximum Loss = $4 + $4 = $8 per share.


Breakeven Points

  • Breakeven for Bear Put Spread 1: The breakeven point is the strike price of the short put minus the net premium paid.
    • Breakeven = $100 – $4 = $96 per share.
  • Breakeven for Bear Put Spread 2: The breakeven point is the strike price of the short put minus the net premium paid.
    • Breakeven = $105 – $4 = $101 per share.
  • Overall Breakeven: Since there are two separate spreads, the overall breakeven point will depend on the behavior of the stock price relative to both spreads.


Risk/Reward Profile

  • Maximum Profit: The maximum profit is limited to the net credit received from the two spreads combined (after considering premiums paid and received).
  • Maximum Loss: The maximum loss is also limited and is the total premium paid for both spreads.
  • Breakeven: There will typically be two breakeven points — one for each spread — and the stock price will need to fall between those two points for the trade to be profitable.


When to Use
  • You expect the price of the underlying asset to decline in stages (not a sharp drop). This strategy can be useful if you expect the asset’s price to move within certain ranges over time, and you want to structure the trade to take advantage of moderate declines over various periods.
  • The strategy works well when you want to limit risk exposure while still profiting from a moderate decline in the underlying asset.
  • It’s useful if you believe the market is moderately bearish and are looking for a flexible way to set up multiple risk/reward scenarios.


Pros

  • Defined Risk: The maximum loss is known in advance and is limited to the net premium paid for the two spreads.
  • Multiple Opportunities for Profit: By combining two Bear Spreads, you can take advantage of multiple price movements or time frames.
  • Cost Efficiency: Like other spread strategies, a Bear Spread Spread can be more cost-effective than buying a single put option outright, as the premium from the sold options helps offset the cost.

Cons

  • Limited Profit: The profit potential is capped, and the strategy will not be as profitable if the underlying asset falls sharply below the lower strike prices.
  • Complexity: This strategy is more complex than a standard Bear Put Spread or Bear Call Spread and may require more management.
  • Requires Correct Timing: You need the price of the underlying asset to decline moderately in a staged manner, and the market must align with your expectations for both legs of the spread.


Example Summary

  • Stock price = $100
  • Bear Put Spread 1: Buy $105 Put for $7, Sell $100 Put for $3 (Net premium paid = $4)
  • Bear Put Spread 2: Buy $110 Put for $10, Sell $105 Put for $6 (Net premium paid = $4)
  • Total Net Premium Paid = $8
  • Maximum Profit = $2 per share (if stock falls below $100)
  • Maximum Loss = $8 per share (if stock stays above $105)
  • Breakeven = $96 (for Spread 1), $101 (for Spread 2)


Conclusion

The Bear Spread Spread (or Double Bear Spread) is a more advanced options strategy that combines two separate Bear Spreads. It’s designed for a moderately bearish outlook and allows for more specific structuring of risk and reward. While the profit potential is capped, it provides flexibility in terms of managing risk over multiple time frames and price ranges. It is most useful in markets where you expect the price of the underlying asset to decline gradually and moderately over time.


Bear Put Spread


A Bear Put Spread is an options trading strategy used when an investor has a bearish outlook on the underlying asset, but wants to limit both the risk and the cost of the trade. It involves buying a put option at a higher strike price and simultaneously selling a put option at a lower strike price, both with the same expiration date.


Key Elements of a Bear Put Spread
  1. Buy a Put Option (Long Put): You purchase a put option with a higher strike price.
  2. Sell a Put Option (Short Put): You sell a put option with a lower strike price.
  3. Same Expiration Date: Both options have the same expiration date.

The strategy benefits from a decline in the underlying asset’s price. The idea is that the price will fall enough for the purchased (long) put to gain value, while the sold (short) put will lose value, but the net loss is limited by the premium collected from the sale.


Objective of a Bear Put Spread

The goal of a Bear Put Spread is to profit from a decrease in the price of the underlying asset while limiting both the potential loss and the cost of entering the trade. This strategy is typically used when an investor expects the price of the asset to drop but does not anticipate a large move downward.


Mechanics of the Trade
  1. Buy a Put: The long put option gives you the right to sell the underlying asset at the higher strike price. You pay a premium for this option.
  2. Sell a Put: The short put option obligates you to buy the underlying asset at the lower strike price if the option is exercised. You receive a premium for selling this option.


Maximum Profit

  • The maximum profit occurs when the price of the underlying asset falls below the lower strike price (the strike price of the put option you sold).
  • The maximum profit is the difference between the two strike prices minus the net premium paid for the spread.Mathematically:
    • Maximum Profit = (Strike Price of Long Put – Strike Price of Short Put) – Net Premium Paid


Maximum Loss

  • The maximum loss occurs if the price of the underlying asset stays above the higher strike price (the strike price of the long put) at expiration.
  • The maximum loss is the net premium paid to establish the position.Mathematically:
    • Maximum Loss = Net Premium Paid


Breakeven Point

The breakeven point is the price at which the total value of the position is zero, meaning the profit from the long put is exactly offset by the loss on the short put. The breakeven point is calculated as the higher strike price minus the net premium paid.


Mathematically

  • Breakeven = Strike Price of Long Put – Net Premium Paid


Example

Let’s consider an example using a stock currently trading at $100.

  1. Buy a put option with a strike price of $100 for a premium of $6.
  2. Sell a put option with a strike price of $95 for a premium of $3.


Net Premium Paid

  • Premium for buying the $100 put = $6
  • Premium for selling the $95 put = $3
  • Net premium paid = $6 – $3 = $3 per share


Maximum Profit

The maximum profit occurs if the stock price falls below $95 at expiration.

  • Maximum Profit = ($100 – $95) – $3 = $5 – $3 = $2 per share


Maximum Loss

The maximum loss occurs if the stock price is above $100 at expiration.

  • Maximum Loss = Net premium paid = $3 per share


Breakeven Point

The breakeven point is the strike price of the long put minus the net premium paid.

  • Breakeven = $100 – $3 = $97 per share


Risk/Reward Profile

  • Risk: Limited to the net premium paid to enter the position.
  • Reward: Limited to the difference between the two strike prices minus the net premium paid.


When to Use a Bear Put Spread
  • You expect the price of the underlying asset to decline moderately.
  • You want to limit the cost of entering a bearish position, as buying a put outright can be expensive.
  • You are looking for a defined risk trade where the maximum loss is known and limited.

Pros

  1. Limited Risk: The risk is limited to the net premium paid, which makes it easier to manage and plan.
  2. Cost-Effective: A bear put spread is generally cheaper than buying a single put option because the premium received from selling the lower strike put helps offset the cost of buying the higher strike put.
  3. Profit from moderate declines: The strategy allows you to profit from smaller, but significant declines in the price of the underlying asset.


Cons

  1. Limited Profit Potential: The profit is capped and will not increase beyond the difference between the two strike prices minus the net premium paid.
  2. Requires Correct Timing: You need the price of the underlying asset to fall within a specific range in a defined time frame for the strategy to be profitable.
  3. Not Ideal for Large Drops: If the price of the underlying asset falls significantly below the lower strike price, the profit will be capped, and a simple long put might have been more profitable.


Example Summary

  • Stock price = $100
  • Buy $100 Put for $6
  • Sell $95 Put for $3
  • Net Premium Paid = $3
  • Maximum Profit = $2 (if stock price falls below $95)
  • Maximum Loss = $3 (if stock price stays above $100)
  • Breakeven = $97 (if stock price is at $97)


Conclusion

The Bear Put Spread is a strategy that is ideal for bearish traders who want to limit their risk exposure while still profiting from a moderate drop in the underlying asset’s price. It is a more affordable alternative to simply buying a put option, and its risk and reward are both defined and manageable. However, its profit potential is capped, and it requires the price to decline moderately for maximum profitability.


Bear Call Spread (Credit Call Spread)


A Bear Call Spread (also known as a Credit Call Spread) is an options trading strategy used when an investor has a neutral to bearish outlook on the underlying asset. This strategy involves selling a call option at a lower strike price and simultaneously buying a call option at a higher strike price, both with the same expiration date.


Bear Call Spread
Steps
  1. Sell a Call Option (Short Call): The trader sells a call option with a lower strike price.
  2. Buy a Call Option (Long Call): The trader buys a call option with a higher strike price.
  3. Same Expiration Date: Both options share the same expiration date.


Objective

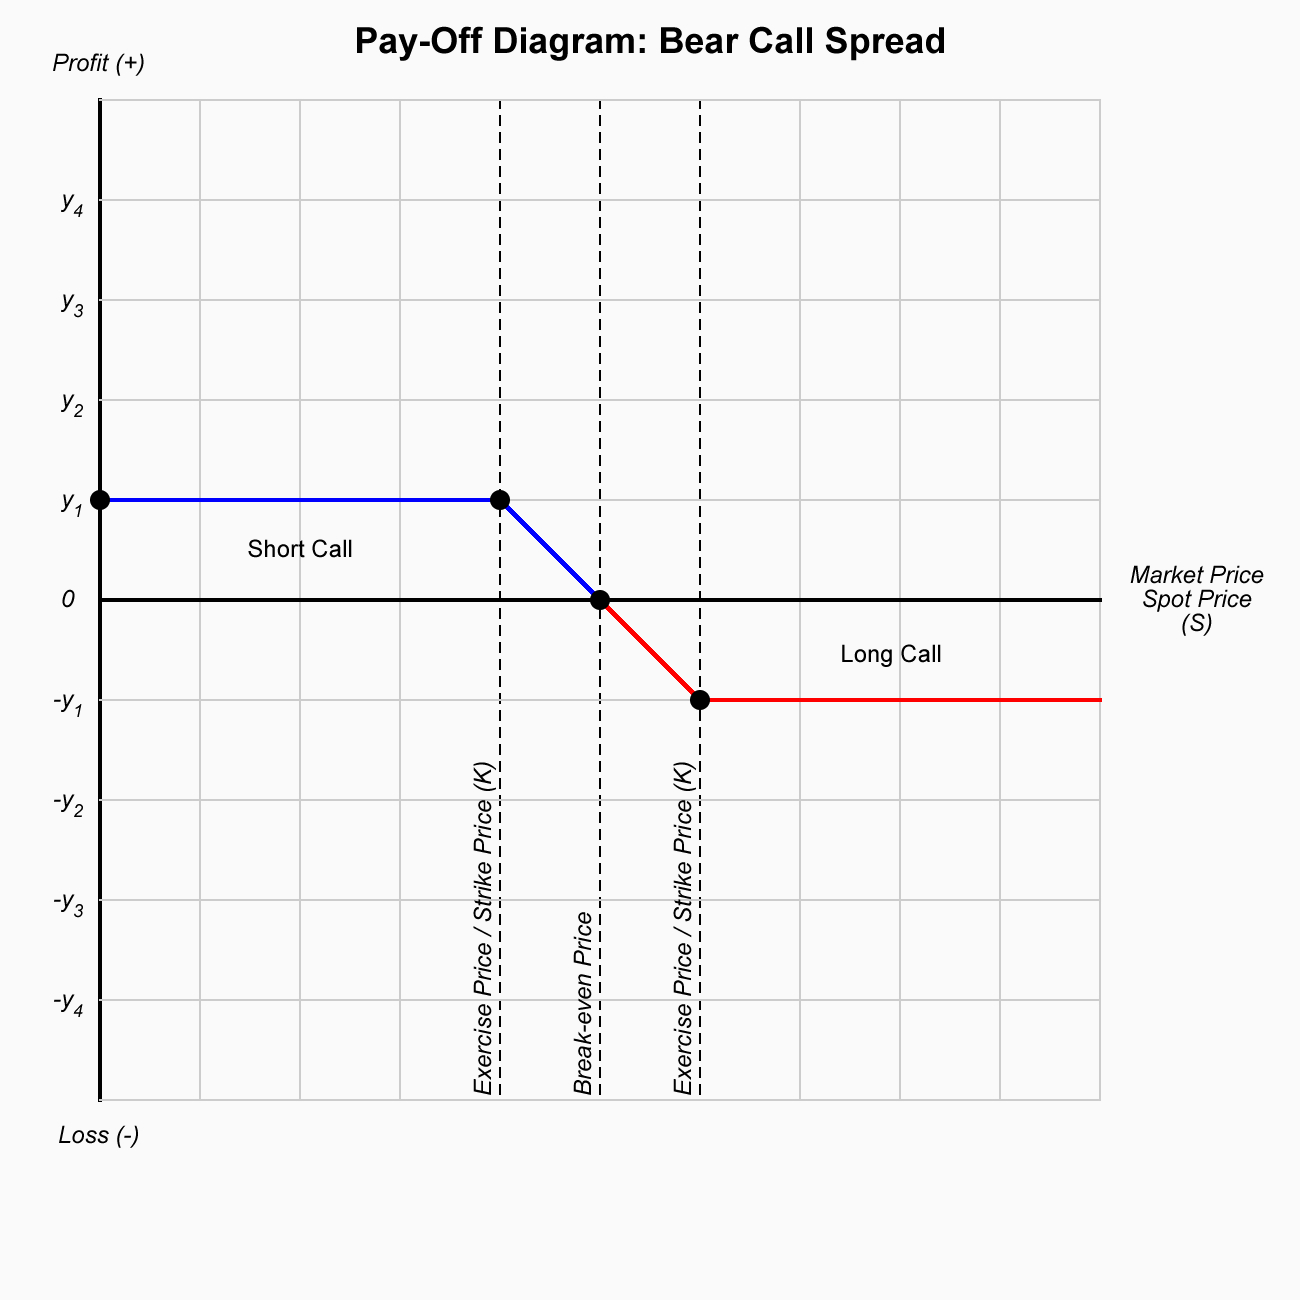
The primary goal of the bear call spread is to generate income through the premium collected from selling the lower strike call option while limiting risk by purchasing the higher strike call option.

Since the strategy is ‘bearish’, it is profitable when the price of the underlying asset remains below the strike price of the call option that was sold (the lower strike), ideally staying as low as possible.


Mechanics
  • Sell the lower strike call: This results in a net credit (you receive money upfront) since the option seller collects a premium.
  • Buy the higher strike call: This requires an upfront debit (you pay for the option), which limits the potential losses.


Maximum Profit

  • The maximum profit is achieved when the price of the underlying asset stays below the strike price of the call option sold (the lower strike).
  • The maximum profit is equal to the net credit received for the trade, which is the difference between the premium received from the sold call and the premium paid for the bought call.


Maximum Loss

  • The maximum loss occurs if the underlying asset price rises above the strike price of the call option that was bought (the higher strike).
  • The maximum loss is the difference between the two strike prices minus the net premium received. This loss occurs if the price of the underlying asset is above the higher strike price at expiration.


Breakeven Point

The breakeven point for the trade is calculated by adding the net premium received to the strike price of the short call. Mathematically:

  • Breakeven = Strike Price of Short Call + Net Premium Received


Example

Let’s consider an example using a stock trading at $100:

  1. Sell a call option with a strike price of $105 for a premium of $3.
  2. Buy a call option with a strike price of $110 for a premium of $1.


Net Premium Received

  • Premium from selling the $105 call = $3
  • Premium for buying the $110 call = $1
  • Net credit received = $3 – $1 = $2 per share


Maximum Profit

The maximum profit occurs if the stock stays below $105 at expiration.

  • Maximum profit = Net credit received = $2 per share


Maximum Loss

The maximum loss occurs if the stock rises above $110 at expiration.

  • Maximum loss = (Difference between the strike prices) – Net credit received
  • Maximum loss = ($110 – $105) – $2 = $5 – $2 = $3 per share


Breakeven Point

The breakeven point is the strike price of the short call plus the net premium received.

  • Breakeven = $105 + $2 = $107 per share


Risk/Reward Profile:

  • Risk: Limited to the difference between the two strike prices minus the premium received.
  • Reward: Limited to the net premium received when entering the trade.


Usage

  • The strategy is best used when you have a neutral to slightly bearish view on the underlying asset.
  • You believe the price of the underlying asset will stay below the lower strike price of the sold call option.
  • It is commonly used in a market environment where volatility is high, as options premiums are typically more expensive, providing better credit for the trade.


Pros

  • Limited risk: Since the position is capped, you know exactly how much you can lose.
  • Income generation: The strategy allows you to collect a premium upfront.
  • Ideal for neutral to bearish markets: Profits are realized when the underlying asset remains below the strike price of the sold call.


Cons

  • Limited profit: The profit potential is capped at the premium received, regardless of how much the price of the underlying asset falls.
  • Margin requirement: Since you are selling a call option, you may need to maintain a margin requirement with your broker to cover potential losses.
  • Potential for losses if the price rises: If the underlying asset’s price rises above the higher strike price, the strategy will result in losses.


Conclusion

The Bear Call Spread is a popular options strategy for those with a neutral to slightly bearish outlook, as it allows traders to collect premium income while limiting downside risk. However, its profit potential is capped, and it requires careful management to avoid significant losses if the price of the underlying asset increases significantly.


Candlestick Patterns: Three Outside Down


Three Outside Down Pattern: Detailed Explanation

The Three Outside Down is a bearish reversal candlestick pattern that appears at the top of an uptrend. It signals a potential trend reversal, indicating that the market is likely to transition from an uptrend to a downtrend. This pattern consists of three candlesticks and is often used by traders to identify entry points for short positions (selling).

The Three Outside Down is part of the “Outside” family of candlestick patterns, which also includes the Three Outside Up pattern (a bullish reversal pattern). The key characteristic of the Three Outside Down is that it shows a strong shift in momentum, where bears overpower the bulls, resulting in a bearish reversal.


1. Components of the Three Outside Down Pattern

The Three Outside Down pattern is composed of three candlesticks, and it typically forms at the top of a bullish trend or after a significant rally in price. The pattern consists of the following components:


First Candle: A Bullish Candle

  • The first candle in the pattern is a bullish candle (also known as a white candle or green candle), which suggests that the market is in an uptrend. This bullish candle should be relatively large, indicating that the bulls are in control of the market at the time.


Second Candle: A Large Bearish Candle

  • The second candle is a long bearish candle (also known as a red candle or black candle) that “engulfs” the first bullish candle. This bearish candle opens higher than the previous candle’s close (which is the body of the first bullish candle) and closes well below the previous candle’s open, showing that the bears have taken control. This suggests a shift in momentum from bullish to bearish, and it marks the beginning of the potential reversal.


Third Candle: Continuation of Bearish Momentum

  • The third candle is a bearish candle, and it continues the downward movement initiated by the second candle. This candle should close lower than the second candle’s close, confirming that the bears have regained full control of the market. The third candle further solidifies the bearish reversal and signals that the uptrend has ended.


2. Visual Representation of the Three Outside Down Pattern

Here’s a diagram that visually shows how the Three Outside Down pattern typically looks:

    ┌─────────────────────┐
    │        Bullish      │
    │   (Small Green)     │
    └─────────────────────┘
    ┌─────────────────────┐
    │        Bearish      │
    │   (Large Red)       │
    └─────────────────────┘
    ┌─────────────────────┐
    │        Bearish      │
    │   (Large Red)       │
    └─────────────────────┘
  • First Candle: A small bullish candle in an uptrend.
  • Second Candle: A long bearish candle that engulfs the first bullish candle.
  • Third Candle: A bearish candle that closes lower than the second candle’s close.


3. Key Features of the Three Outside Down Pattern

To ensure that the Three Outside Down pattern is valid, the following key features should be observed:


First Candle (Bullish Candle)

  • The first candle must be a bullish candle that is part of an established uptrend. The body of the candle should be relatively small or medium in size, indicating continued upward momentum.


Second Candle (Large Bearish Candle)

  • The second candle must be a long bearish candle (red or black), which completely engulfs the body of the first candle. This shows a strong shift in sentiment, with the bears taking control.
  • The second candle’s open must be above the close of the first candle, and its close must be below the open of the first candle.


Third Candle (Bearish Continuation)

  • The third candle should also be a bearish candle that closes lower than the close of the second candle. This confirms that the market is moving in the bearish direction, solidifying the reversal and the beginning of a downtrend.


4. Interpretation of the Three Outside Down Pattern

The Three Outside Down pattern signals a reversal of an uptrend and indicates that the market is likely to enter a downtrend. Here’s how to interpret the pattern:

  • First Candle (Bullish): The first bullish candle shows that the market is in an uptrend, and traders are optimistic. However, this uptrend may be weakening.
  • Second Candle (Large Bearish): The large bearish candle that engulfs the first bullish candle is the key element of the pattern. This shows that the bears have overpowered the bulls, causing the price to close lower than the previous candle’s open. It signals the start of a reversal as selling pressure increases.
  • Third Candle (Bearish Continuation): The third bearish candle confirms that the reversal is valid. The price continues to fall, showing that the bears are still in control, and the trend is shifting from bullish to bearish.


5. Trading the Three Outside Down Pattern

The Three Outside Down pattern is typically used by traders to enter a short position (selling) in anticipation of a bearish move. Here’s how to trade the pattern effectively:


Entry

  • Enter a short position after the third bearish candle closes, confirming that the trend has reversed. This is the point where you expect the market to continue moving down.


Stop Loss

  • Place a stop loss above the high of the second candle, as this is the highest price reached during the formation of the pattern. If the market moves higher than this level, it suggests that the bearish reversal might not be valid.
  • Alternatively, you can place the stop loss just above the first candle’s high to limit the risk in case the market breaks above the reversal point.


Take Profit

  • Target the next key support level: This is the most common way to set a target when trading the Three Outside Down pattern. If there is no clear support level, you can use a risk-to-reward ratio (e.g., 2:1 or 3:1) to set your profit target.


Risk Management

  • Make sure to use proper risk management by only risking a small percentage of your trading capital on each trade (e.g., 1-2% per trade).
  • Additionally, consider using other technical indicators like the Relative Strength Index (RSI) or Moving Average Convergence Divergence (MACD) to confirm the strength of the trend reversal.


6. Confirmation and Additional Indicators

While the Three Outside Down pattern is a powerful signal on its own, traders often look for additional confirmation to improve the accuracy of their trade:

  • Volume: Ideally, the second bearish candle should have high volume, showing that there is strong selling pressure. A third candle with a strong close can also indicate increased bearish momentum.
  • Momentum Indicators: Tools like the Relative Strength Index (RSI), MACD, or Stochastic Oscillator can confirm that the market is not in overbought territory and that there is room for the trend to continue down.
  • Trend Indicators: A confirmation of the reversal with indicators such as moving averages can provide additional confidence. For example, if the price is above the 50-day moving average and the pattern forms, it might suggest that the trend reversal is strong.


7. Limitations and Risks

Like any candlestick pattern, the Three Outside Down has its limitations:

  • False Signals: As with all reversal patterns, there is a risk of false signals. If the market does not follow through with the expected reversal, the pattern can produce losses.
  • Trend Context: The pattern is most effective when it forms after a strong uptrend. If the market is in a sideways or consolidating range, the pattern may not be as reliable.
  • Stop Loss Strategy: If the stop loss is placed too tightly, the pattern might get triggered, even if the trend reversal is valid. On the other hand, if the stop loss is placed too far away, the risk-to-reward ratio might become unfavorable.


8. Conclusion

The Three Outside Down pattern is a powerful candlestick pattern that indicates a bearish reversal at the top of an uptrend. It consists of three candles:

  1. A small bullish candle.
  2. A large bearish candle that engulfs the first candle.
  3. A second bearish candle confirming the continuation of the downward movement.

This pattern is used by traders to identify potential short entry points, betting on the continuation of the downtrend. Proper confirmation through volume, trend indicators, and other momentum tools can increase the reliability of the pattern.

As always, it’s crucial to use appropriate risk management when trading with candlestick patterns and to combine them with other technical analysis tools to increase the chances of success.


Candlestick Patterns: Three Line Strike


Three Line Strike Pattern: Detailed Explanation

The Three Line Strike is a bullish or bearish reversal candlestick pattern that occurs in the context of a strong price trend. It signals the potential reversal of the prevailing trend, either from bearish to bullish or from bullish to bearish. This pattern is widely used by traders for spotting trend reversals, especially after a strong move in the market.

The pattern consists of four candles and can be found in both bullish and bearish variations, depending on the direction of the trend and the candles involved. The pattern is sometimes also referred to as a “Three Black Crows” or “Three White Soldiers” pattern, depending on whether it indicates a reversal from bearish to bullish or vice versa.


1. Three Line Strike Pattern Overview

The Three Line Strike pattern can be broken down into the following components:


Bullish Three Line Strike

  • This pattern signals a potential reversal of a downtrend into an uptrend.
  • It consists of four candlesticks:
    1. Three consecutive bullish candles: The first three candles are bullish, meaning each one closes higher than the previous one, showing a strong upward movement.
    2. One large bearish candle: The fourth candle is a long bearish candle that opens above the previous bullish candle but closes lower than the third bullish candle. This large bearish candle “engulfs” the previous three candles, signaling that the bulls have been overpowered by the bears temporarily.
    3. After this large bearish candle, the market typically reverses and continues the uptrend, confirming the bullish reversal.


Bearish Three Line Strike

  • This pattern signals a potential reversal of an uptrend into a downtrend.
  • The pattern consists of:
    1. Three consecutive bearish candles: The first three candles are bearish, meaning each one closes lower than the previous one, showing a strong downward movement.
    2. One large bullish candle: The fourth candle is a long bullish candle that opens below the previous bearish candle but closes higher than the third bearish candle. This large bullish candle “engulfs” the previous three candles, signaling that the bears have been overpowered by the bulls temporarily.
    3. After the large bullish candle, the market typically reverses and continues the downtrend, confirming the bearish reversal.


2. Visual Representation of the Three Line Strike Pattern

Here’s how the Three Line Strike pattern typically appears:


Bullish Three Line Strike:

   ┌──────────────────────┐
   │        Bullish       │
   │    (Small Green)     │
   └──────────────────────┘
   ┌──────────────────────┐
   │        Bullish       │
   │    (Medium Green)    │
   └──────────────────────┘
   ┌──────────────────────┐
   │        Bullish       │
   │    (Large Green)     │
   └──────────────────────┘
   ┌──────────────────────┐
   │        Bearish       │
   │    (Long Red)        │
   └──────────────────────┘
  • The first three candles are bullish, each with a higher close than the previous candle.
  • The fourth candle is bearish, a long red candle that closes below the third bullish candle and “engulfs” the previous three candles.


Bearish Three Line Strike:

   ┌──────────────────────┐
   │        Bearish       │
   │    (Small Red)       │
   └──────────────────────┘
   ┌──────────────────────┐
   │        Bearish       │
   │    (Medium Red)      │
   └──────────────────────┘
   ┌──────────────────────┐
   │        Bearish       │
   │    (Large Red)       │
   └──────────────────────┘
   ┌──────────────────────┐
   │        Bullish       │
   │    (Long Green)      │
   └──────────────────────┘
  • The first three candles are bearish, each with a lower close than the previous candle.
  • The fourth candle is bullish, a long green candle that closes above the third bearish candle and “engulfs” the previous three candles.


3. Key Elements of the Three Line Strike Pattern

For the pattern to be considered valid, the following conditions should generally be met:


Bullish Three Line Strike (Reversal of Downtrend)

  • Strong downtrend: The pattern should appear in the middle of a strong downtrend, signaling the potential reversal of that trend.
  • Three bullish candles: The first three candles should be bullish, with each candle closing higher than the previous one, showing upward momentum.
  • Fourth large bearish candle: The fourth candle is a long bearish candle, which should open above the close of the third bullish candle but close well below it, engulfing the first three bullish candles. This shows that the bears have temporarily overpowered the bulls.
  • Confirmation: After the bearish candle, the market typically reverses back in favor of the bulls, continuing the uptrend.


Bearish Three Line Strike (Reversal of Uptrend)

  • Strong uptrend: The pattern should appear in the middle of a strong uptrend, signaling the potential reversal of that trend.
  • Three bearish candles: The first three candles should be bearish, with each candle closing lower than the previous one, showing downward momentum.
  • Fourth large bullish candle: The fourth candle is a long bullish candle, which should open below the close of the third bearish candle but close well above it, engulfing the first three bearish candles. This shows that the bulls have temporarily overpowered the bears.
  • Confirmation: After the bullish candle, the market typically reverses back in favor of the bears, continuing the downtrend.


4. Interpretation of the Three Line Strike Pattern

The Three Line Strike pattern is often interpreted as follows:

  • Bullish Three Line Strike: The first three candles show a strong downtrend and a series of rising bullish candles. This indicates that the price is recovering after a downtrend, but the fourth large bearish candle temporarily reverses this progress. When the market continues higher after the pattern is completed, it signals that the downtrend is over and a new uptrend has begun.
  • Bearish Three Line Strike: The first three candles show a strong uptrend and a series of falling bearish candles. This indicates that the price is correcting after an uptrend, but the fourth large bullish candle temporarily reverses this correction. When the market continues lower after the pattern is completed, it signals that the uptrend is over and a new downtrend has begun.


5. How to Trade the Three Line Strike Pattern

Traders can use the Three Line Strike pattern to enter positions based on the potential trend reversal. Here’s how to approach trading with this pattern:


Bullish Three Line Strike (Reversal of Downtrend)

  1. Entry: After the fourth candle (the large bearish candle) closes and the reversal is confirmed, traders can enter a long position (buy). The idea is to capture the continuation of the new uptrend.
  2. Stop Loss: Place a stop loss just below the low of the fourth candle or the recent swing low. This will limit the loss if the reversal does not occur and the downtrend resumes.
  3. Take Profit: Traders may target the next significant resistance level or use a risk-to-reward ratio (such as 2:1 or 3:1) to set profit targets.


Bearish Three Line Strike (Reversal of Uptrend)

  1. Entry: After the fourth candle (the large bullish candle) closes and the reversal is confirmed, traders can enter a short position (sell). The idea is to capture the continuation of the new downtrend.
  2. Stop Loss: Place a stop loss just above the high of the fourth candle or the recent swing high. This will limit the loss if the reversal does not occur and the uptrend resumes.
  3. Take Profit: Traders may target the next significant support level or use a risk-to-reward ratio (such as 2:1 or 3:1) to set profit targets.


6. Confirmation and Additional Indicators

While the Three Line Strike pattern itself can be powerful, traders often look for additional confirmation before acting on the signal:

  • Volume: Ideally, the fourth large candle should have increased volume compared to the previous candles, confirming the strength of the reversal.
  • Trend Indicators: Use moving averages, such as the 50-period or 200-period moving average, to confirm that the overall trend is in place before the pattern appears.
  • Momentum Indicators: Tools like the Relative Strength Index (RSI) or Stochastic Oscillator can be used to confirm overbought or oversold conditions, adding confidence to the potential reversal.


7. Limitations of the Three Line Strike Pattern
  • False Signals: Like any candlestick pattern, the Three Line Strike is not foolproof. If the market does not follow through with the reversal, the pattern can produce false signals.
  • Requires Context: The pattern is most effective when identified in the context of a strong trend. In sideways or choppy markets, the pattern may be less reliable.
  • Stop-Loss Considerations: If the pattern does not lead to the expected trend reversal, it’s important to use a stop loss to minimize losses. Be cautious of false breakouts that can happen after the formation of the pattern.

8. Conclusion

The Three Line Strike is a powerful candlestick pattern that signals potential trend reversals. Whether it’s a bullish reversal (from downtrend to uptrend) or a bearish reversal (from uptrend to downtrend), the pattern consists of four candles: three consecutive trend-following candles followed by one large reversal candle that engulfs the previous candles.

Traders can use this pattern to enter trades in the direction of the new trend, confirming the reversal with volume, trend indicators, and momentum indicators. As with any candlestick pattern, it is essential to apply good risk management and confirm the pattern with other technical tools.


Candlestick Patterns: Hikkakke


Candlestick Chart: Hikkake Pattern Explained

The Hikkake pattern is a technical analysis pattern used in candlestick charting to predict price reversals. It is particularly helpful in identifying false breakouts or break-ins, where the price moves in one direction briefly before reversing and heading in the opposite direction. The Hikkake pattern is essentially a “trap” that tricks traders into thinking a breakout is occurring, only for the market to move against them shortly thereafter.

Let’s break down the components of the Hikkake pattern and how it’s used:


1. What is a Hikkake Pattern?

The Hikkake pattern occurs when a price briefly breaks out of a prior range (either above resistance or below support) and then quickly reverses, trapping traders who entered the market based on the initial breakout. Essentially, it’s a false breakout followed by a quick reversal in the opposite direction.


2. Types of Hikkake Patterns

There are two primary types of Hikkake patterns:

  • Bullish Hikkake: This occurs when the price breaks below a support level (a false breakdown), but then quickly reverses and moves higher, often triggering a short squeeze or a surge in buying.
  • Bearish Hikkake: This happens when the price breaks above a resistance level (a false breakout), and then reverses lower, trapping long traders and causing the price to fall.


3. Identifying the Hikkake Pattern

A typical Hikkake pattern involves several key steps:

Bullish Hikkake (False Breakdown):

  1. Initial Breakdown: The price moves below a well-defined support level, which may signal a bearish trend.
  2. False Breakout: After breaking below support, the price quickly reverses direction and climbs back above the support level.
  3. Confirmation: A candlestick closes above the support level after the breakdown, confirming that the previous breakdown was a false signal.
  4. Reversal: The price moves in the opposite (upward) direction, trapping short traders who were expecting further downside movement.

Bearish Hikkake (False Breakout):

  1. Initial Breakout: The price moves above a resistance level, which could signal a bullish trend.
  2. False Breakout: After briefly moving above resistance, the price reverses and moves back below the resistance level.
  3. Confirmation: A candlestick closes below the resistance level, confirming the breakout was false.
  4. Reversal: The price moves downward, trapping long traders who were expecting further upside.


4. Candlestick Structure

The candlestick pattern itself usually involves two or more candles:

  • First Candle: The breakout candle (either above resistance or below support).
  • Second Candle: The reversal candle, which shows the price quickly moving back in the opposite direction.
  • Third Candle (optional): Some traders look for a confirmation candle that solidifies the reversal and confirms the direction of the new trend.


In the case of a Bullish Hikkake, the first candle would show a break below support, and the second candle would be a strong reversal back above support. The third candle (optional) would confirm the new uptrend.

For a Bearish Hikkake, the first candle would show a break above resistance, followed by a strong reversal back below resistance, with the third candle confirming the downtrend.


5. How to Trade the Hikkake Pattern

Traders use the Hikkake pattern as a way to identify false breakouts, and thus, potential entry points. Here’s how you might approach trading with a Hikkake pattern:

Bullish Hikkake (False Breakdown):

  1. Entry: After the price breaks below the support level and then closes back above it, enter a long position.
  2. Stop Loss: Place a stop just below the recent low or below the support level to manage risk.
  3. Target: Set a profit target based on the previous resistance levels or using a risk-to-reward ratio, like 2:1 or 3:1.


Bearish Hikkake (False Breakout):

  1. Entry: After the price breaks above the resistance level and then closes back below it, enter a short position.
  2. Stop Loss: Place a stop just above the recent high or resistance level.
  3. Target: Set a profit target based on previous support levels or use a risk-to-reward ratio to define your exit.


6. Important Considerations
  • Volume: Higher volume during the breakout or breakdown and lower volume during the reversal is a positive confirmation of the pattern. It shows that the initial breakout was not supported by strong buying or selling interest and that the reversal has more conviction.
  • Market Context: A Hikkake pattern works best in a range-bound market or after consolidation. In trending markets, the price may break through support or resistance and continue without reversing, which can make false breakouts less reliable.
  • False Breakouts: False breakouts (or “fakeouts”) are a common feature of many financial markets, and the Hikkake pattern is one way to capitalize on such scenarios. Recognizing these traps can help you avoid entering trades at the wrong time.
  • Risk Management: As with all trading strategies, good risk management practices are key. Be sure to use stop losses and only risk a small percentage of your capital on any single trade.


7. Advantages of the Hikkake Pattern
  • Identifies Trap Situations: The Hikkake pattern helps traders identify when the market is likely to reverse after a false breakout, allowing them to take advantage of price moves that other traders may miss.
  • Can Work on Multiple Time Frames: The Hikkake pattern is versatile and can be used on short-term charts (like 5-minute or 15-minute) for intraday trading, as well as on longer-term charts (like daily or weekly) for swing or position trading.


8. Limitations of the Hikkake Pattern
  • Requires Confirmation: The Hikkake pattern needs confirmation from subsequent candles, and without confirmation, the pattern may fail to materialize.
  • False Signals: Like any pattern, the Hikkake can generate false signals, particularly in volatile or highly trending markets. In these cases, the market may continue in the breakout direction, leaving traders who acted on the reversal signal at a loss.
  • Context-Sensitive: The pattern works best in sideways or range-bound markets, and its reliability decreases in strong trending markets where breakouts tend to be more sustainable.


Conclusion

The Hikkake pattern is a useful tool for detecting false breakouts or breakdowns and identifying potential price reversals. It helps traders avoid falling into the trap of chasing false moves and can be a valuable addition to any technical analysis toolkit. However, like all technical patterns, it requires practice and proper risk management to be effective.

If you’re considering using this pattern, it’s essential to also look for other supporting factors like volume, trend direction, and the overall market environment to enhance its reliability.